Bitcoin is capturing the full attention of the financial world. It is currently stabilizing after an impressive run. Many investors are now asking a crucial question: Is this the right time to get interested in Bitcoin? This article provides a detailed analysis of the situation. We will explore important technical indicators, examine market sentiment, and finally, decipher the underlying trends shaping the future of this fascinating cryptocurrency. This comprehensive guide will give you the keys to navigate this complex and exciting ecosystem.
Bitcoin’s Price Under Close Watch
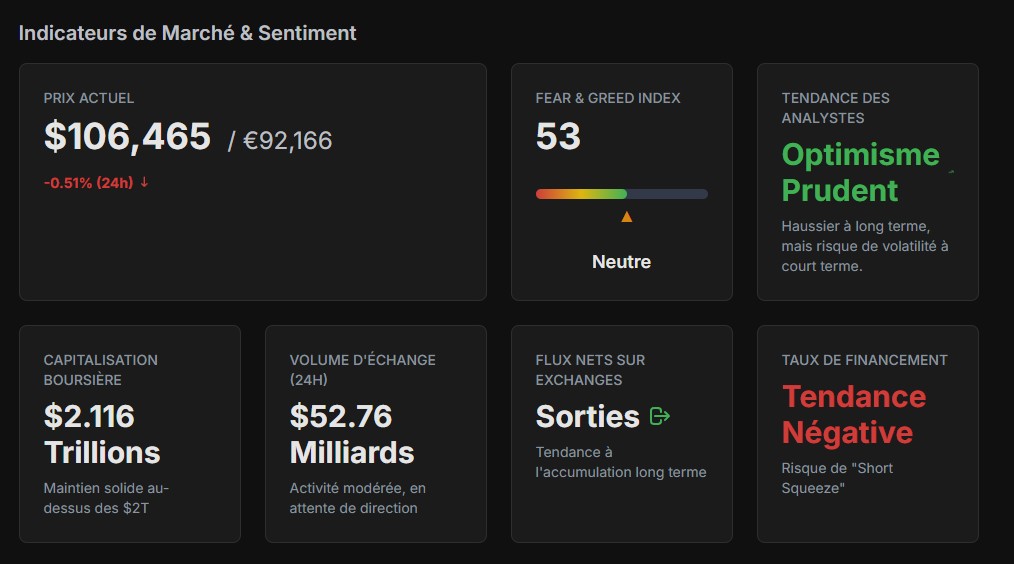
Bitcoin’s price is consolidating its recent gains. It is currently trading around the $107,000 threshold. This stabilization phase is entirely normal and often follows a period of strong increase.
However, trading volume has slightly increased. This indicates an intense battle between buyers and sellers. Buyers are fiercely defending important support levels, while sellers are taking advantage of the highs to take profits.
Furthermore, volatility remains an essential characteristic of the market. Price movements can be rapid and unpredictable. It is therefore crucial to understand this context. Investors are carefully watching every fluctuation, looking for clues about the market’s next direction.
Thus, the current price zone is a true point of equilibrium. The exit from this zone will likely set the tone for the coming weeks.
Deciphering Market Sentiment: Between Caution and Neutrality
To understand Bitcoin, one must analyze investor emotions. The “Fear & Greed” index is a valuable tool for this. Currently, this index stands at 53. This score corresponds to a “Neutral” sentiment. The market is therefore neither in a state of panic selling nor euphoric buying. It’s a phase of waiting and indecision.
Indeed, a neutral sentiment has several advantages. It suggests that the market has purged previous excesses of optimism, thereby building a healthier foundation for future growth.
Many analysts prefer this phase of relative calm. It often precedes more sustainable and less speculative price movements. Consequently, savvy investors are not rushing. They are waiting for a clear confirmation before committing. Monitoring the evolution of this index is therefore essential. A move into the “Fear” zone (<40) could signal a buying opportunity. Conversely, a return to the “Greed” zone (>60) would call for caution.
Analyst Opinions: Cautious Optimism Prevails
Industry experts share a common vision. They display cautious optimism regarding Bitcoin. In the long term, the underlying trend remains resolutely bullish. Several factors explain this confidence.
First, institutional demand via spot Bitcoin ETFs is massive. These investment funds continuously buy Bitcoin for their clients, creating structural and lasting buying pressure.
However, in the short term, caution is advised. Analysts point out that Bitcoin is facing a very strong technical resistance zone, which is its former all-time high.
Furthermore, the global macroeconomic context can influence the market. Central bank decisions on interest rates remain a factor of uncertainty. Thus, experts do not rule out a temporary correction. Such a decline could even be healthy for the market, as it would liquidate over-leveraged positions. In conclusion, analysts see the current period as an opportunity for consolidation before a new wave of growth.
Technical Analysis: Support and Resistance Levels
Technical analysis provides us with a price map. It identifies key zones where the market might react. Understanding these levels is fundamental to any strategy.
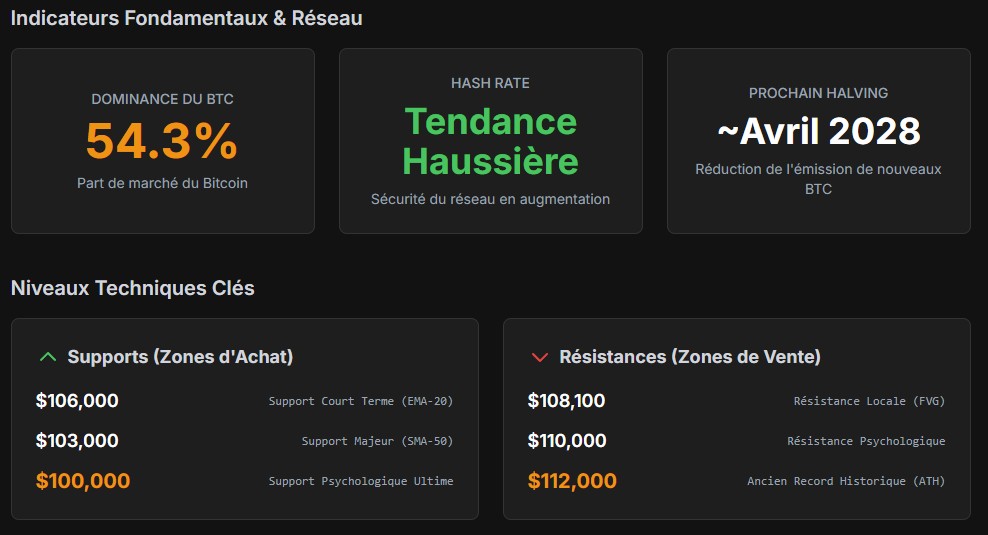
First, let’s examine the supports. These are price floors where buyers intervene massively. The first support is located around $106,000. This is an immediate defense zone.
Next, the major support is found near $103,000. It corresponds to an important 50-day moving average. Finally, the ultimate psychological support is at $100,000. A drop to this level would be a major test for the market.
On the other hand, we must watch the resistances. These are price ceilings where sellers dominate. The first local resistance is at $108,100. The price recently failed at this level. Main resistance is then in the $110,000 to $112,000 zone. This is the former all-time high. Breaking this barrier would require strong conviction from buyers. A clean break of this ceiling would likely signal the beginning of a new phase of euphoria.
On-Chain Data Reveals the Underlying Trend
Data coming directly from the Bitcoin blockchain is a goldmine. It reveals the behavior of long-term investors. A very clear trend is emerging. We are observing massive and continuous outflows of Bitcoin from exchange platforms. Concretely, investors are withdrawing their BTC to store them in secure personal wallets.
This behavior has a very strong implication. It reduces the supply of Bitcoin immediately available for sale. This is what is known as a “supply shock.” The fewer BTC available for sale, the greater the impact an increase in demand can have on the price.
Furthermore, this demonstrates a deep conviction on the part of holders. They have no intention of selling in the short term. They anticipate a future appreciation in the value of Bitcoin. This underlying trend, invisible on a classic price chart, is one of the strongest arguments for optimists.
The Influence of Derivatives: A High-Tension Market
The derivatives market greatly influences the price of Bitcoin. Open interest, which represents the total amount of unclosed futures contracts, is at a very high level. It reaches about $72 billion.
This enormous figure means that a lot of capital is engaged in leveraged bets. Consequently, the market is extremely sensitive and can react violently.
Moreover, another indicator to watch is the funding rates. Currently, they show a slightly negative trend. This means that speculators betting on a price decrease (the “shorts”) are in the majority. They are even paying those who are betting on a rise.
This situation is paradoxical and creates a risk of a “short squeeze.” If the price starts to rise, short sellers will be forced to buy back their positions to limit their losses. these forced buybacks create a new wave of buying, which propels the price even higher, very quickly. It’s an explosive scenario that many traders are anticipating.

Should You Invest in Bitcoin Today? Possible Scenarios
So, what decision should be made with all this information? There is no single answer. It all depends on your investor profile and your time horizon. However, we can outline two main scenarios based on the current data.
The first scenario is bullish. It would be triggered by a clean break of the $108,100 resistance. Such a break, combined with the pressure of the “short squeeze,” could propel the price towards its all-time high, and beyond. On-chain data and institutional demand strongly support this possibility in the medium term.
The second scenario is a correction. A break of the $106,000 support could lead the price towards the $103,000 or even $100,000 zone. For long-term investors, such a pullback would likely be seen as an excellent buying opportunity. It would allow the market to breathe before starting again on a healthier basis.
Disclaimer: This article is provided for informational and educational purposes only. It does not constitute investment advice in any way. Cryptocurrencies are volatile assets, and you should do your own research before making any investment decisions.